
Category
Strategic SourcingDate Posted
May 22, 2026Here’s a question most procurement directors can’t answer in under ten minutes: what did your organisation spend on facilities maintenance across all locations last quarter? Not the budget figure. The actual spend. By supplier, by plant, by contract status. If pulling that takes a week of spreadsheet work, your spend analysis in procurement has a visibility gap that’s costing real money.
This guide covers what spend analysis is, how the process works from data collection through to action, where AI fits in, and what separates teams that use it for genuine cost reduction from teams that produce a report once a year and file it.
What Spend Analysis Actually Means
So what is spend analysis in practical terms? It’s the process of collecting, cleaning, classifying, and examining your procurement spend data to understand where money goes, with whom, and whether you’re getting value. A team without it walks into a supplier negotiation with a rough sense of last year’s number. A team with it walks in knowing the exact figure, which alternatives quoted lower last quarter, and whether the current terms are still competitive.
Why This Matters More in 2026 Than Five Years Ago
Procurement budgets are under pressure everywhere. If your team can’t prove where the savings opportunities sit, finance will cut headcount instead of funding them. Supply chains got more complex: more suppliers, more geographies, more categories. Without structured visibility, you’re blind on 30% or more of addressable spend. And ESG reporting requirements keep growing. You need to know who your Tier 1 suppliers are and what you’re spending with each. Not approximately. For more on the forces driving this, see our piece on procurement challenges in 2026.
Procurement Spend Analysis: Definition, Scope, and Objectives
Procurement spend analysis is the structured examination of purchasing data to identify who you buy from, what you buy, how much you pay, and whether any of it can be done better. Scope covers direct spend (raw materials, components), indirect (IT, facilities, travel), and tail spend (the long tail of low-value purchases nobody manages).
The objective isn’t a dashboard. It’s actionable intelligence. Which categories are over-indexed on a single supplier? Where’s the biggest gap between contracted and actual pricing? Which business units buy outside of policy? Those questions answered with data, not anecdotes.
Spend Analysis in Procurement vs Procurement Spend Analytics
These get used interchangeably. They’re not the same. Spend analysis is periodic. You pull the data, clean it, classify it, produce a report. Backward-looking. What happened last quarter?
The analytics layer is the real-time system on top. Dashboards that update as transactions flow in. Alerts when a category spikes 20% above forecast. Trend lines showing supplier pricing drifting up over six months. Analysis is the audit. Analytics is the monitoring system running between audits.
The Spend Analysis Process
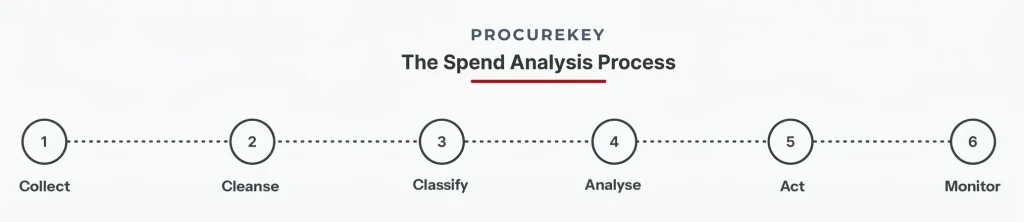
- Collect. Pull spend data from every source: ERP, accounts payable, expense management, P-cards. If you leave P-cards out, you’re missing 10 to 15% of total spend before you’ve started.
- Cleanse. Duplicates, inconsistent supplier names (IBM vs International Business Machines vs IBM Corp), missing fields. A dataset with 20% errors produces recommendations nobody trusts
- Classify. Map transactions to a category taxonomy. UNSPSC is common. This is where AI makes the biggest difference. Manual classification on 50,000 transactions takes weeks. AI does it in hours.
- Analyse. Where is spend concentrated? Which categories have the fewest suppliers? Where are the gaps between contract and actual pricing?
- Act. Use findings to run sourcing events, renegotiate contracts, consolidate suppliers
- Monitor. Keep tracking. One-off exercises produce a report. Ongoing monitoring produces a sourcing strategy.
Types of Spend Analysis
Supplier spend analysis: who you’re buying from and how concentrated the risk is. Category analysis: what you’re buying and where consolidation or competition can drive cost down. Contract compliance: where actual purchasing behaviour deviates from negotiated terms. And tail spend analysis: the thousands of low-value transactions that bypass procurement and collectively add up to 20% of total spend at most organisations. Different lens, same underlying data.
Key Metrics That Matter in Procurement Spend Analysis
Five numbers worth tracking. Spend under management: what percentage flows through governed procurement channels? Addressable spend: what could be sourced competitively but currently isn’t? Contract compliance rate: how often does the organisation buy at the negotiated price versus off-contract? Supplier concentration risk: what happens if your top supplier for a critical category goes down? And savings capture rate: how much of the savings your sourcing events identified actually showed up in the financial results? That last one is where most teams discover a gap between the procurement report and the finance report.
Strategic Spend Management Through Spend Analysis
This is what happens when the analysis starts driving decisions instead of filling slide decks. Your team spots that 40% of MRO spend is unmanaged. That’s not a report finding. That’s a sourcing project. Three plants buying the same material from three different suppliers at three different prices? That’s a consolidation opportunity worth six figures. The analysis shows where money goes. The strategy redirects it. Platforms built for autonomous sourcing make the jump from finding to action faster because the sourcing event launches from the same data that spotted the opportunity.
Turn Spend Visibility Into Sourcing Action
How AI Spend Analysis Is Transforming Procurement
How Al Changes Spend Analysis

Auto-Classification

Anomaly Detection

Predictive Insights
Traditional spend analysis tells you what happened, AI spend analysis tells you what to do next.
Traditional analysis takes weeks. Pull data. Clean it. Classify 50,000 transactions by hand. Build the report. By the time findings reach a decision-maker, they’re already stale. AI compresses that cycle from weeks to hours.
What changes? AI classifies transactions automatically with 95%+ accuracy. It flags anomalies: a supplier whose pricing jumped 18% last quarter, a business unit whose off-contract spend tripled, duplicate invoices that got paid twice. And it surfaces recommendations proactively. The system flags a consolidation opportunity the week the data shows the pattern, not six months later during a quarterly review. ProcureKey builds this into the sourcing workflow. See how with AI in procurement.
Using Procurement Spend Analytics for Better Decisions
The analytics layer changes how sourcing decisions get made. Before: the category manager runs an RFQ because the contract is expiring, evaluating on price and memory. After: the analytics show this category’s spend rose 8% year over year, three of five suppliers have declining quality scores, and two alternatives quoted lower on a related category last quarter. Same RFQ. Better starting position. For more on connecting intelligence to execution, read our guide to procurement automation.
Common Challenges
Data quality is the bottleneck. Inconsistent supplier names across systems, missing category codes, transactions sitting in AP unclassified. Second: coverage gaps. If the analysis only covers ERP-processed spend and ignores P-cards and expense reports, the picture is incomplete by 20%.
And then the action gap. The analysis identifies $2M in consolidation opportunities. Nobody owns the follow-through. The report gets filed. The savings never materialise. That’s the most expensive failure mode because the work was done. The value just leaked.
Best Practices for Getting Real Value
Start with completeness. Pull from every source. ERP, AP, expense management, P-cards. If money leaves the organisation, it belongs in the analysis. Then invest in classification. A well-structured taxonomy is the difference between actionable data and a dataset you stare at.
Make it continuous. An analysis done once a year is outdated by the time it’s presented. Quarterly minimum. Monthly for strategic categories. And tie every finding to an action owner. No finding without a follow-up. No consolidation opportunity without a sourcing event scheduled to capture it.
Role of Spend Analysis Software
The right spend analysis software automates data ingestion, cleansing, AI-powered classification, and dashboard visualisation. But the real question is whether findings connect to action. A consolidation opportunity identified in the analysis should link directly to a sourcing event in the same platform. Most standalone BI tools can’t close that gap. That’s what separates a purpose-built platform from a generic reporting tool.
For M365 organisations, a platform inside the Microsoft ecosystem means no separate infrastructure, inherited security policies, and data governance that follows your existing IT standards.
What’s Coming Next
Three trends. Real-time intelligence is replacing periodic reporting. The quarterly review is giving way to live dashboards that flag issues as transactions come in. AI classification accuracy is hitting the point where manual categorisation isn’t needed for 90%+ of transactions, freeing analyst time for the 10% that requires judgment. And spend analysis is merging with sourcing execution. Instead of producing a report and then going off to run an RFQ separately, the platform spots the opportunity and creates the event in the same workflow. Teams that get there first will have a cost advantage that compounds quarter over quarter.
Frequently Asked Questions
Spend analysis in procurement is not a reporting exercise. It’s the foundation every sourcing decision should sit on. The teams that treat it as a one-off project get a report. The teams that treat it as a continuous discipline get a cost advantage that compounds every quarter. The data is there. The question is whether your process turns it into action or lets it age in a spreadsheet nobody opens.